

Indigo improves grower profitability, environmental sustainability and consumer health through the use of natural microbiology and digital technologies. They are a biotech startup taking traditional agriculture to a whole new level. Utilizing beneficial plant microbes and agronomic insights, Indigo works with growers to sustainably produce high-quality harvests. The company then connects growers and buyers directly to bring these harvests to market. Working across the supply chain, Indigo is forwarding its mission of harnessing nature to help farmers sustainably feed the planet.
Their Challenge
At the end of Q3, Indigo announced a new service offering, Indigo Marketplace, a transparent and efficient supply chain connecting buyers and growers through their digital platform. In the month leading up to the launch, Indigo wanted an infographic created for their website to show visitors the impressive expansion of the Marketplace over the last five months.
Indigo had a high-level idea of what they wanted to portray in the graphic, but they didn’t know how it could be done. They came to their strategic partner, New Breed Marketing, for help bringing this vision to life.
Our Process in Motion
Indigo has found a way to disrupt the agriculture market through an innovative growing solution that is beneficial for farmers, consumers and the environment. Our team wanted to create an infographic that mirrored Indigo’s creativity and innovation. Instead of creating a simple, stagnant infographic, New Breed developed a dynamic time lapse to more visually demonstrate the massive growth the Indigo Marketplace has experienced in the last five months.
To create the interactive infographic, our team leveraged the d3 and TopoJSON javascript libraries to push the location data onto a topographic map of the United States. A JavaScript library is a set of pre-written JavaScript functions, which can be integrated and customized to extend the native functionality of a CMS.
- The D3.js library helped to build the interactive features of the infographic.
- The TopoJSON library helped encode the topology of the map seen in the infographic.
In the backend of the infographic, Indigo’s team can upload spreadsheets of data and the structure will scrape, merge and push it into an HTML5 canvas in the browser. From there, the data is visualized in the timeline along the bottom of the graphic and the supply and demand volumes on the right side. With this structure, Indigo can continue updating the infographic as their Marketplace continues to expand. Our plan to expand upon Indigo's original infographic to deliver this dynamic version was a bold move since our team only had a month to bring the project to life.
The Infographic
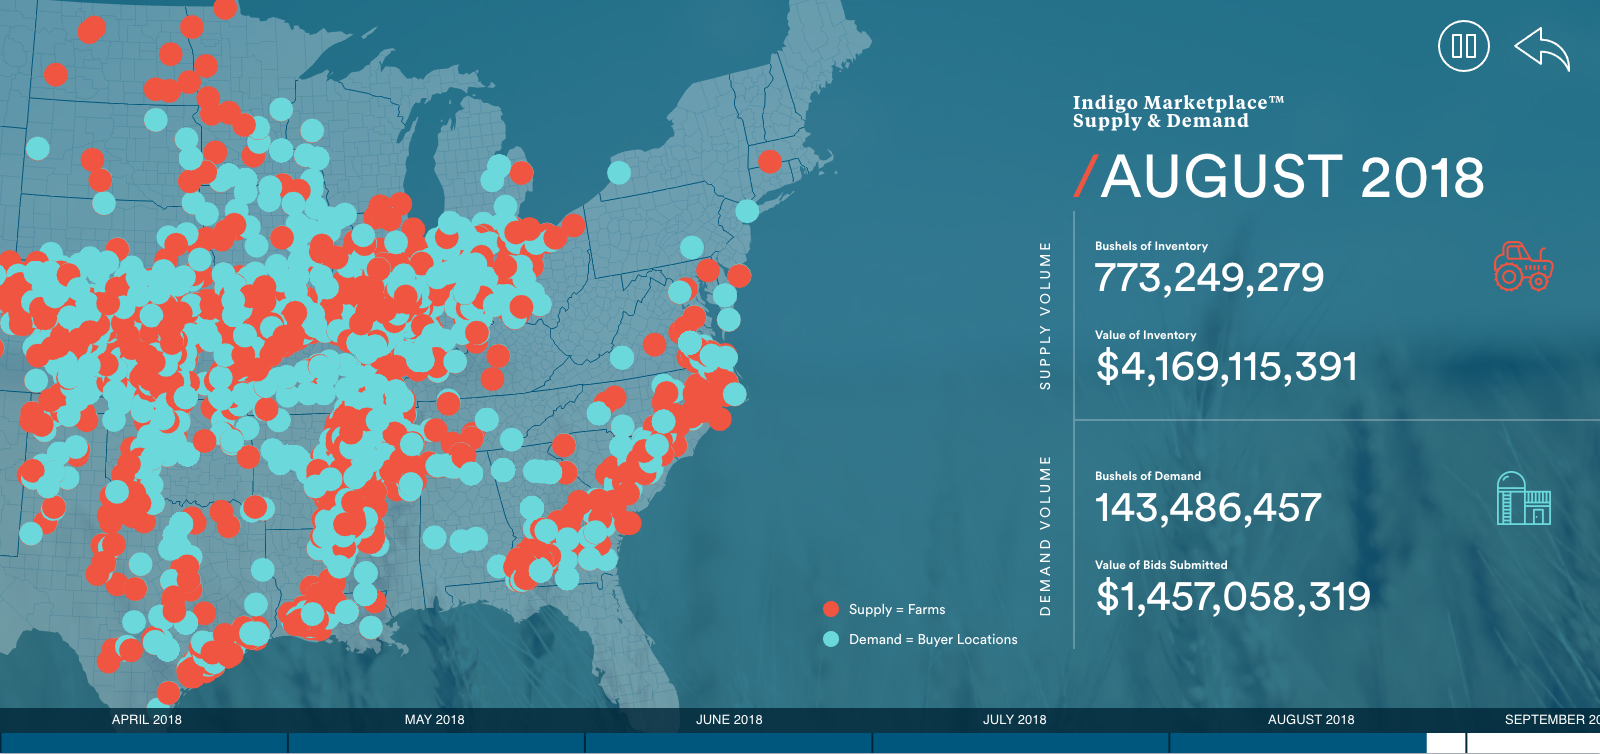
At the beginning of the time lapse, the graphic is simply an empty map of the United States. As the timeline at the bottom moves, viewers watch as the map begins to fill with red and blue dots. The red dots indicate the farmers who have joined the marketplace revolution and the blue dots indicate the buyers who have joined. Alongside the visual, viewers see the statistics regarding bushels of inventory and bushels of demand within the Marketplace. Indigo wanted this graphic to be the crown jewel of the Marketplace’s webpage and we hope we didn’t disappoint.
The Results
Indigo’s main goal for this interactive graphic was to increase awareness of the Marketplace with a stunning visual to demonstrate its success. By highlighting the intense growth the Marketplace has already experienced, Indigo wants to encourage more farmers and buyers to join them in the supply chain.
Indigo announced the release of the Marketplace on the same day we debuted their dynamic infographic. On this day, their website traffic doubled, and throughout the following week, traffic remained steadily above their normal average.
The dynamic image has only been live for eight days and already has generated 5,000 page views, with an average time of two minutes or longer per view. This increase in traffic and page views has also lead to the generation of 79 new contacts over the same duration of time.
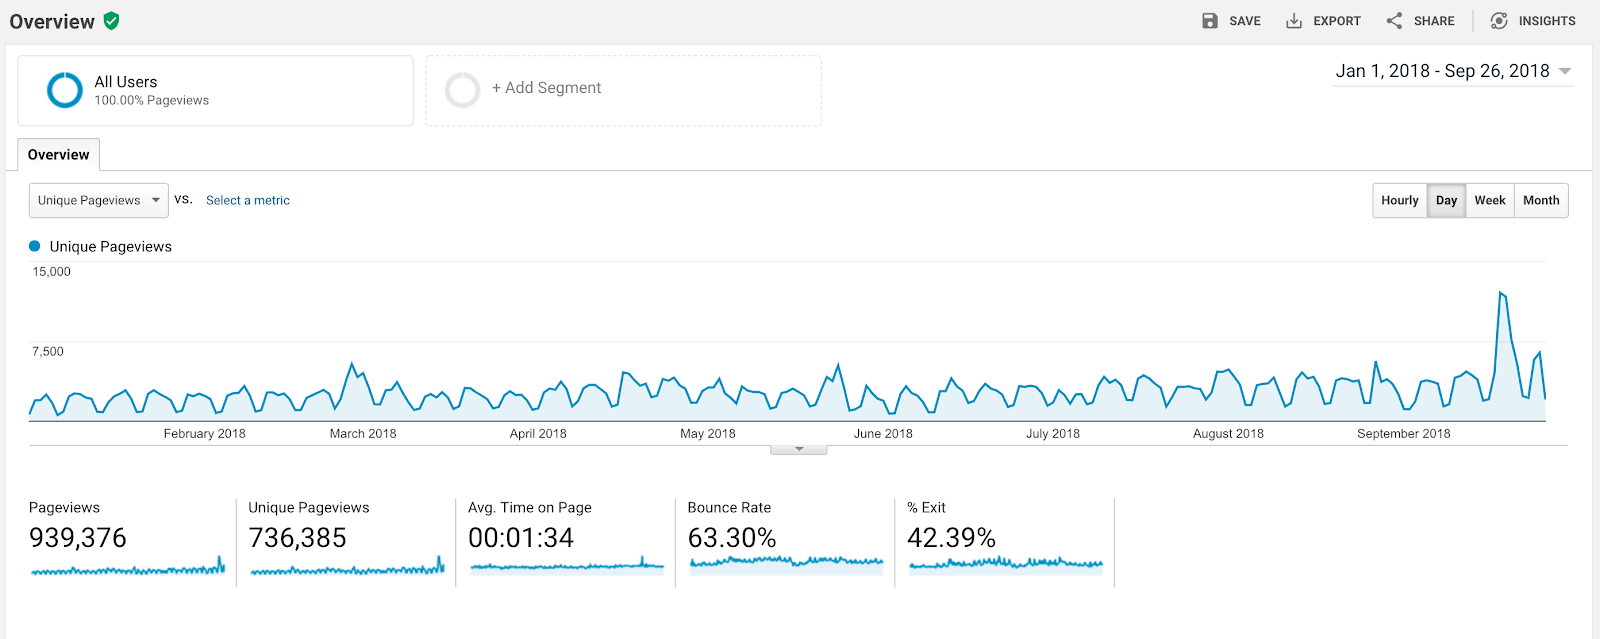
Unique page views year to date with launch
While the dramatic increase in website traffic alone is impressive, the referral traffic is another noteworthy factor resulting from the graphic. In particular, TechCrunch and The Hustle are two sources of referral traffic that stand out as the press release got picked up and further increased traffic.

Impact
With the crown jewel of an interactive infographic supporting the launch of the Indigo Marketplace, Indigo has seen an increase in website traffic and gained recognition from business industry leaders for their achievements. On the same day as the graphic and press release launch, Indigo was featured in a Bloomberg article highlighting their recent round of funding that raised $250 million dollars to help expand the digital marketplace.
“Besides using software to link farmers with customers, the marketplace will fuel Indigo’s other businesses by providing information about crop performance. ‘At some level everything we do is about data, and it all relates to one another,’ Perry [Indigo's CEO] said. ‘A big part of the reason we gather data in the farms is to understand how our microbes are doing.’”
The following day, Indigo was featured on Forbes in an article commending the company for its ability to use a natural seed coating to help plants thrive.
“Dig this: Indigo Agriculture, a tech startup in Boston, Massachusetts, makes seed treatments that help plants grow. The technology involves coating the seeds of corn, rice, soybeans and wheat with natural microbes. The result? Plants thrive like they're supposed to.”
By providing website visitors with a visual understanding of their company’s progress, Indigo has rapidly increased engagement with their buyer personas, expanded their reach through larger scale recognition and encouraged farmers and consumers to join their movement.
Interested in accelerating your growth with the help of a Diamond-tier HubSpot partner? We'd love to discuss your unique growth goals and help you formulate a plan for achieving them in 2019. All you've got to do is reach out.