

.png?width=1200&name=Copy%20of%20Q3%20Blog%20Images%20(11).png)
Driving customer retention, success and up-sells are key elements to sustaining and accelerating your company’s growth goals.
Churn, a measure of the number of individuals that stop doing business with your company over a specified period, can drag these efforts and metrics down.
Because of this, churn is one of the most important metrics you can measure, and it should inform many of your marketing and customer service efforts.
By failing to keep track of your churn rates, you lose an opportunity to gain insight into early-stage indicators of increasing or decreasing churn trends, and ultimately, the health of your business. Companies who fail to truly track churn can lose a chance to accelerate growth or, more importantly, avoid decline.
Why is SaaS Churn Important?
Let’s take a figurative example of a B2B SaaS startup, Examp.ly:
- Customers: 50
- Annual Contract Value (ACV) of each deal: $12,000
- Monthly Recurring Revenue (MRR): $50,000
- Churn rate: 4% month over month
To make sure we start on the same page, let’s take a closer look at the monthly recurring revenue (MRR) number outlined above. Examp.ly’s MRR is $50,000. That figure is calculated by dividing the annual contract value (ACV) of each deal by 12 to get the average monthly value of each deal. That calculation comes out to be $1,000.
Average Monthly Value of Each Deal = $12,000 ÷ 12 months = $1,000/month
From there, the average monthly value of each deal ($1,000) is multiplied by the total number of deals (also the total number of customers, which is 50) to find the MRR.
MRR = $1,000 × 50 = $50,000
With this clarification, we can continue. On the surface, everything appears normal for Examp.ly, but their churn rate is 4% month over month. Looking at the table below, we can see just how many customers will be lost in a year’s time if they are unable to lower their monthly churn.
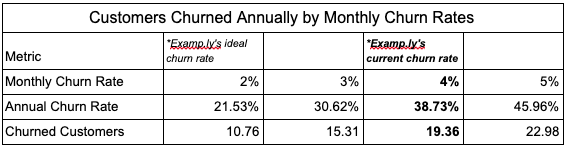
By observing this table, you can see that with a 4% churn rate Examp.ly will lose 19.36 customers over the course of a year — a large pool of their total customers.
It’s also worth noting that Examp.ly’s 4% monthly churn rate is applied to a smaller and smaller MRR total every month. With that in mind, their annual churn rate is not simply calculated by multiplying 4% by the number of months the rate is applied, 12, to get 48%.
To illustrate, follow this example. In the first month, the amount of total MRR churned is 4% of $50,000 which equals $2,000.
Churned Total Month 1 = $50,000 × 4% = $2,000
However, in the second month, the amount of total MRR churned is 4% of $48,000 (because the other $2,000 was already churned).
Churned Total Month 2 = $48,000 × 4% = $1,920
Combining the figures, the total amount churned over the two months was $3,920.
Total Churned Over 2 Months = Churned Total Month 1 + Churned Total Month 2 = $2,000 + $1,920 = $3,920
$3,920 is only 7.84% of $50,000 even though 4% was churned each month because the number of customers decreased each month. As a result of the decreasing total MRR, over a 12-month period Examp.ly’s annual churn rate turns out to be 38.73%. With this in mind, you can calculate their total amount of churned revenue.
Churned Total for a 12-Month Period = $50,000 × 38.73% = $19,365
From there, observe Examp.ly’s total remaining MRR (the amount that wasn’t churned) after this 12-month period is approximately $30,635.
Total Remaining MRR After 12-Month Period = $50,000 − $19,365 = $30,635
Below, you can see an abridged table showing what happens to Examp.ly’s total MRR with different churn rates. The table starts at month 0; think of this as January 1st of the new year. From there, month 1 represents the end of the first month — or January 31st.
Also, note the table’s 12-month-MRR total after a 4% churn rate ($30,635.49). This number is just a slightly more precise version of the $30,635 figure we just presented.
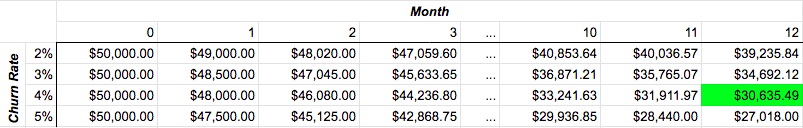
With this table, you can see that Examp.ly would have saved almost $9,000 in revenue had they had a 2% churn rate instead of a 4% churn rate.
Difference in Total MRR After 12 Months = $39,235.84 - $30,635.49 = $8,600.35
This clearly reveals the importance of decreasing churn for your business. For a more visual representation, take a look at the following graph.
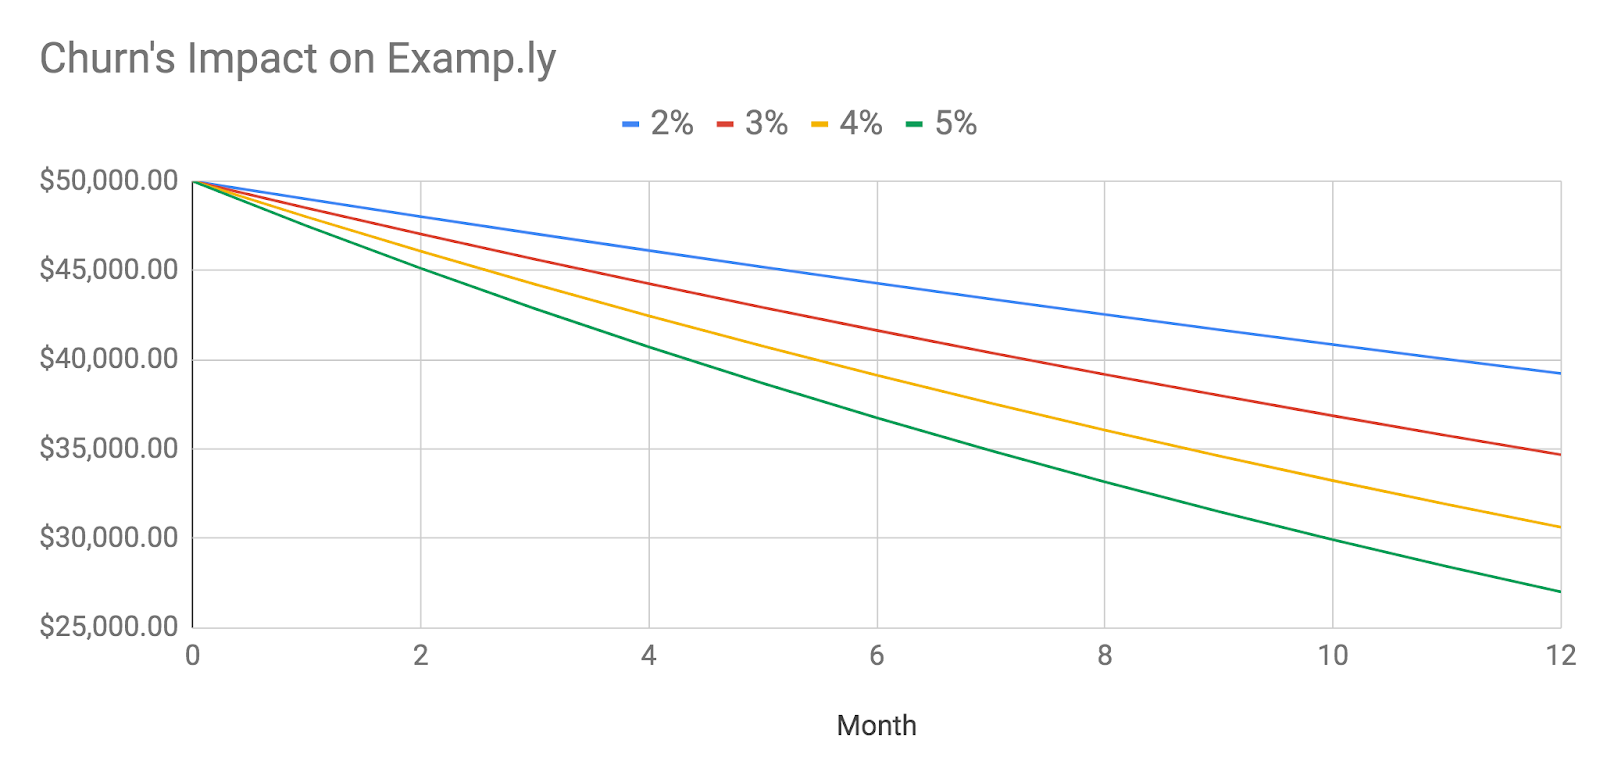
Like the table above, this graph demonstrates the importance of paying attention to churn. Just look at how much less revenue is left after 12 months with a 5% churn rate compared to 12 months with a 2% churn rate.
Of course, this data is entirely fictitious, but it does clearly illustrate how churn is incredibly important to SaaS growth. Now that you see the importance of monitoring your churn rates and reducing them, let’s look at four ways you can measure churn.

4 Ways to Measure Churn
Measuring churn at an aggregate level, or as a percentage of overall customers and associated revenue lost, is not enough. No aggregate is ever going to perfectly communicate a particular customer behavior. But, while an initial aggregated churn metric will never tell you the entire story, it cues you in and forces you to dig deeper for answers — answers to how you can retain more customers and successfully grow.
To help you dig deeper, here are four common ways that SaaS companies measure churn and why they are important:
By Number of Customers: By the number of customers or accounts that churned over a given time period (week, month, quarter, etc.)
This method allows you to see churn as a percentage of total accounts at a high level and can be compared over time to see larger trends.
By Revenue: Lost MRR from customers who churned in the month
Tracking churn this way allows you to see the revenue impacted because of your churn rate to adjust forecasting, hiring and long-term growth goals because of your churn rate.
By Number of Users or Licenses: Lost users or licenses within product instances in the month
This method allows you to evaluate your subscription model to see what accounts are decreasing in usage, may be more likely to churn entirely in the future and deserve immediate attention from your customer success team.
By Product Downgrade: By the revenue lost due to product downgrades as percentage of expected MRR
Software downgrades slow your growth rate, are indicative of lower product use and, when measured proactively, can be leveraged as predictive indicators of customers churning entirely in the future. As such, measuring downgrades can be used as a way to direct customer success resources in addition to informing you about your growth trajectory.
Key Takeaway
In terms of metrics, revenue matters most for your company, but there are many benefits to understanding, monitoring and reporting on churn at a granular level.
With churn, you are able to better understand the needs of your customers and the strengths and weaknesses of your product. From there, you can look backward up your funnel to determine what marketing and sales tactics drive customers with better retention rates and higher lifetime value.
By analyzing churn and the factors that influence it, you can gain a better picture of the true health of your business. This is especially important in an era where customer success is critical to your scaling efforts.

Tag(s):
Demand Generation