

We’ve said it once and we’ll say it again — when it comes to creating an effective marketing strategy, you need lots of data.
You also need a way of distilling that data down into manageable, actionable pieces so it can be used to contribute to the bigger picture. While there are endless ways to collect, organize, and analyze marketing data, there are definitely some common metrics that all marketers should be taking into account.
Not too long ago, the funnel was seen as the end-all-be-all of marketing performance.
But since the Inbound Conference of 2018, the flywheel has reigned supreme in the realm of inbound marketing strategy. While we thoroughly agree with the premise of the flywheel, we believe there is still merit to the insight and KPIs that the funnel relies on, more specifically how those metrics relate to each other.
Using those metrics, a business could gain valuable insight into how their marketing efforts were performing and adjust accordingly.
Table of Contents:
- Introduction to Marketing KPIs
- Company-Wide Marketing KPIs
- Content Marketing KPIs
- Email Marketing KPIs
- Marketing Operations KPIs
- Product Marketing KPIs
- Paid Advertising KPIs
- Essential Marketing Function KPIs
What Are Marketing KPIs?
Marketing key performance indicators (KPIs) are metrics that tell marketers how well (or poorly) their efforts are performing and if they’ve achieved — or are on pace to achieve — their goals. Marketing teams determine which KPIs to track depending on the campaign, the channel being used, and the goals of the campaign. Some common marketing KPI categories include:
- Company-Wide Marketing KPIs
- Content Marketing KPIs
- Email Marketing KPIs
- Marketing Ops KPIs
- Product Marketing KPIs
- Paid Advertising KPIs
Each category has a unique set of KPIs.
For example, content marketing KPIs will include organic traffic, SERP rankings, and bounce rate. For email marketing, you’ll typically track open rate, click-through rate (CTR), and unsubscribe rate.
When thinking about your marketing key performance indicators, there are a couple of things that should be evaluated no matter what metric you’re looking at:
-
The source. If you have a certain metric that’s valuable to your business, knowing where it came from will prove to be highly important to get more of them.
-
The content, form, page, etc. contributed to the creation of a valuable metric. For example, if all of your leads are converting on a single piece of content, it’s a fairly good bet to say that other content like that will be successful in the future as well.
Now, let’s get into exactly which metrics your business should be paying attention to!

Marketing KPIs That Impact All Functions
Return on Investment (ROI)
The primary marketing KPI that is often tracked by executives is ROI. ROI answers the question, “Did the campaign or strategy generate more value than what the company invested in it?". Most companies determine marketing ROI by tracking revenue, which is the right metric for most marketing campaigns. But for brand awareness campaigns, defining what the “return” is can be tricky. After all, it’s difficult to attribute revenue to brand-building efforts.
ROI FORMULA
To calculate your marketing ROI, you first need to determine your net revenue:
Money in (gross revenue) - Money spent (marketing cost) = Net revenue
Once you have your net revenue, here’s the formula to calculate ROI:
(Net revenue / Marketing cost) x 100 = ROI percentage
Here’s an example. Let’s say you spent $100 on marketing and generated $150 in revenue. Your ROI would be 50%. Here’s what it looks like in the formula:
$150 (revenue) - $100 (marketing cost) = $50 (net revenue)
$50 (Net revenue) / $100 (marketing cost) = 0.5
0.5 x 100 = 50.0, or 50% ROI
If you’re not a math person and can’t remember to Please Excuse My Dear Aunt Sally, don’t worry. We won’t do any more math or formulas for the rest of this blog.
Revenue Attribution
Revenue attribution measures which marketing investments led to closed deals. Companies use revenue attribution to find out what marketing efforts actually led to revenue. This KPI helps you determine what worked and what didn’t work, so you can make smarter decisions going forward as you double down on what delivered results.
This is a great metric to show company leadership if you want to ask for more budget and resources. Where ROI will tell you if marketing is generating a positive return overall, revenue attribution tells you how much revenue you generated through specific channels, content, or campaigns.
Sales Pipeline Velocity
Sales pipeline velocity measures how fast a prospect moves through each stage of your sales pipeline.
While it may seem at first glance to be more of a sales KPI than a marketing one, marketing plays a significant role in increasing pipeline velocity. Marketing’s job isn’t just to generate leads. A high-performing marketing team will also be able to address and overcome a lead’s objections before they ever talk to sales. Use this KPI to identify how well your marketing team is nurturing leads prior to a sales conversation and then make improvements where necessary.
Churn Rate
Churn rate is the rate at which customers leave and stop receiving services from a business.
You might be wondering, “But wait, isn’t this a KPI for the services team?”. Yes, but not entirely. Marketing has a role in reducing churn by setting clear expectations and orchestrating effective customer marketing. Churn rate can help marketers identify if they have a potential messaging problem that they need to resolve.
Cost Per Lead (CPL)
Cost per lead (CPL) measures how much a company spends to generate one lead.
To measure CPL, you’ll need to factor in any costs associated with marketing campaigns such as advertising spend, design services, and promotional materials. Then, divide the total number of leads generated by those costs (I know…math — but only one or two more the rest of the way). It’s important to remember CPL doesn’t take into account how much revenue you generated.
It only measures how much it costs you to generate a lead. This is useful for tracking the effectiveness of your campaigns, which strategies you need to double down on, and which ones you need to ditch.
Essential Marketing Function KPIs
Visitors
The first marketing key performance indicator that should be taken into account are the visitors that come to your website. Put simply, the number of visitors your website is getting over a predetermined period of time is valuable to know because it’s the starting point. By knowing how many visitors you’ve gotten, you’ll then know how many of them have to move to each stage of the funnel in order for your business to close the number of customers it needs.
Leads
The next key performance indicator to look at is the leads. This may seem obvious, but it’s a very important metric to the overall health of your business. Keeping track of your leads over time will allow you to see patterns in performance and give guidance on what your visitors find the most valuable.
Qualified Leads
Unfortunately, not all of your leads will be a perfect fit for a B2B business. That’s why the next key performance indicator is qualified leads. Knowing which leads are qualified helps shed light on how effective your website and content is at bringing in leads that are a fit for your business.
Within the field of qualified leads lives our marketing qualified leads (MQLs), and sales qualified leads(SQLs). Both are essential to keep track of so that you can see where the gaps in your funnel might be.
Opportunities
Next comes the metric that represents your “opportunities” or the people who are interested and a fit for your business. The most important thing to know when it comes to opportunities is how many of them became customers. This (along with other less measurable things) will help to hone your sales process.
Content Marketing KPIs
Published Marketing Content
Published marketing content is the number of actual content pieces you publish in a certain time period.
With this KPI, it’s important to remember that more isn’t always better. The purpose of this KPI isn’t to help you create as much content as possible. There’s no magic number of content you need to create to be successful. This KPI simply tracks whether or not you’re reaching your goals for how much content you set out to publish. Whether that’s a little or a lot will depend on your strategy.
Organic Traffic and Top Entry Pages
Let’s bend the rules and squeeze two KPIs into one. These two are so closely related that it only makes sense to combine them. Organic traffic is how many visits your website had that originated from a search engine, like Google. Top entry pages will tell you which of your website’s pages are the first page a user visits on your site.
Combined, these two metrics will help you identify which content is attracting the most visitors to your website.
SERP Rankings
SERP stands for “search engine results page”.
This helps you track how high your content is ranking in search results. Every time a user enters a query (aka, searches for something) on Google or another search engine, what they see after that is a SERP. SERP rankings tell you the average position your content appears on a SERP for the keywords the search engine has determined your content is relevant for.
Social Shares and Engagement
You might have seen these KPIs referred to as “vanity metrics”. Despite the nickname, these KPIs can give you a lot of insight into what kind of content and messaging resonates with your audience. Social shares measure how many times your social content is shared or reposted. Social engagement measures how many likes (or loves, laughs, etc.) and comments your social posts generated.
They’re only vain if they’re the only thing you care about. But looking at them in the context of other KPIs can provide some really powerful insights.
Bounce Rate
Every content marketer's worst nightmare. Bounce rate is the rate at which a visitor lands on one of your website pages, then leaves your site without taking any other action. A high bounce rate usually indicates your audience isn’t digging your content. A high bounce rate can sting, but it’s extremely useful in terms of charting out next steps.
By tracking bounce rate, you’ll get a better feel for how to capture your audience’s attention and what it takes to convert them into a lead.
Email Marketing KPIs
Click-Through Rate (CTR)
Click-through rate (CTR) measures how many of your subscribers clicked on a link within your email.
A high CTR is the holy grail of email marketing. Tracking this KPI will help you identify if your email content is not just interesting, but compelling enough for subscribers to click for more. Average CTRs vary by industry and even depend on the overall purpose of your email strategy. If the primary value of the content is delivered within the email, but you offer secondary options to click through for more — don’t expect a high CTR.
Nonetheless, if you want to succeed at email marketing, tracking CTR is a must.
Subscriber Count and Growth
Need we say more? Subscriber count is the number of people subscribed to your email list. Subscriber growth tracks how many new subscribers have joined your email list in a given time period. In reality, these metrics give you more insight into how your points of conversion are performing (landing pages, pop-up forms, etc.), rather than your actual email content itself.
Tracking this metric is important to know the opportunity you have with email as one of your marketing channels.
Open Rate
Open rate tracks how many subscribers opened your email. There’s really not much else to say here. But if you’re struggling with your open rate, hone in on your subject lines, from address, and preview text. These are what a subscriber sees in the email inbox and all work together to convince someone to actually open your email.
Click-To-Open Rate
Click-to-open rate (CTOR) is CTR’s Type A sibling. CTOR measures how many people who actually opened your email went on to click a link. CTR, on the other hand, measures how many out of all your subscribers clicked on a link — even if they didn’t open your email.
CTOR tells you, very specifically, if a subscriber who read your email was compelled to take an action you wanted them to take.
Unsubscribe Rate
The unsubscribe rate tracks how many people in your email list unsubscribed per email sent.
If you send an email to 100 subscribers, and two people unsubscribe, that’s a 2% unsubscribe rate (I know, more math, but this should be the last time).
You can’t expect to have a 0% unsubscribe rate — and that’s actually a good thing. You want people on your email list who will engage with your emails. People who unsubscribe are saying “I’m not interested in this anymore”. And that’s okay! Your content won’t be for everybody. But if too many people are saying they’re no longer interested — then that’s a sign of a potential problem.
Marketing Operations KPIs
Conversion Rate
Conversion rate measures the percentage of people who took the desired action when engaging with your website content or other marketing campaigns. “Conversion” can refer to any type of action. Examples include:
- How many visitors on a landing page filled out a form
- How many users who visited your website booked a demo or contacted you
- How many users who read a blog post downloaded a corresponding piece of gated content
- How many people who saw an ad or piece of content as part of a marketing campaign became a lead
Conversion rate is similar to CTR in that it measures how successful you are at convincing someone to take the action you want them to take. The difference is that with CTR, the desired action is simply clicking a link in a paid ad or in an email, while the conversion rate’s desired action usually involves clicking the main call-to-action on a website or filling out a form.
Simply put, conversion rate measures how effective you are at moving people through the marketing funnel, from top-of-the-funnel (TOFU) to middle-of-the-funnel (MOFU) to bottom-of-the-funnel (BOFU).
Net Promoter Score (NPS)
Net promoter score (NPS) is an essential KPI for measuring customer satisfaction. However, it doesn’t just measure how well you’re meeting customer expectations, but how likely customers are to recommend you to a friend or colleague.
This KPI is typically tracked through customer surveys, where you’ll gather both quantitative and qualitative data. In other words, you’ll want to include multiple choice, sliding scale, or yes or no questions as well as open text questions to gather specific feedback from your customers. For marketing, NPS is a great way to get information on your customers that you can use to inform your marketing strategy.
Traffic Distribution
Traffic distribution tells you how people are getting to your site. This KPI is broken down into what percentage of total traffic to your site can be categorized as direct traffic, organic traffic, referral traffic, social traffic, and paid traffic. This KPI is useful for knowing what channels are most effective at driving web traffic, what sources you need to improve, or even what sources you need to either focus less on or adjust your strategy for.
There’s no perfect traffic distribution to have. It all depends on what your strategy is and what your goals are for driving traffic to your site.
Customer Lifetime Value (CLV)
Also commonly referred to as the Lifetime Value of a Customer (LTV), this KPI tells you how much revenue you can expect to generate from a single customer.
This is a helpful metric for determining how much you should invest in marketing. By comparing LTV to customer acquisition cost, or CAC (see below), you can get a decent sense of whether you’re spending too much on marketing. A CAC that’s higher than your LTV means you most likely need to trim your marketing budget.
That being said, don’t be too quick to draw conclusions from this. As with all of these KPIs, they need to be viewed in context. If your churn rate is really high, for example, your LTV will suffer. If that’s the case, It may be a smarter move to invest in reducing churn rather than cutting marketing spend.
Product Marketing KPIs
Trial and Demo Sign-Ups
This KPI is exactly what it sounds like: the number of people signed up for a trial or a demo of your product. When looking at this metric, you’ll also want to look at your website’s conversion rate (given the desired action is to sign up for a trial or request a demo). If you’re not getting as many trials or demos as you’d like, you should focus on improving your conversion rate.
Product Usage
Product usage measures how users are, well, using your product. This metric can help you identify what UX changes need to be made or what features and functionality you need to add, remove, or improve. Product usage can be broken down into more granular KPIs, which include:
- Total Users: Number of users per customer
- Feature Engagement and Adoption: How many users are leveraging a certain feature or functionality
- Time to X: How long it takes for users to onboard or complete certain actions with your product
Product Quality (Support Tickets and Escalations)
One way to measure product quality is through the volume of support tickets or escalations that come through. By closely monitoring this, you’ll get a sense of whether or not your product is delivering on the expectations of customers or if there are any critical issues that need to be addressed.
While this metric is particularly applicable to dev and services teams, marketing teams can monitor it to learn about their customers and how they can optimize their strategy and messaging.
Paid Advertising KPIs
Impressions and Reach
These KPIs are similar, but there’s an important difference. Impressions are how many times your ad was seen. Reach tracks how many individual users saw your ad at least once. Because of that, your impressions will likely be higher than your reach.
The value in tracking impressions and reach is knowing how much of a given audience you’ve put your brand in front of and how many times, on average, a user has seen your ad.
Customer Acquisition Cost (CAC)
CAC measures how much money you’re spending to acquire one customer. This KPI is extremely helpful for making projections, especially when making changes to the budget. If you know your CAC and LTV, you can make decent projections for how an increase or decrease in the budget will impact revenue.
Lead-To-Customer Conversion Rate
This KPI measures how many leads become customers. It’s similar to the general conversion rate, but instead of tracking how well you are converting a lead to the next stage of the marketing and sales funnel, it measures how successful you are at converting someone at the button of the funnel into actually becoming a customer.
You can use this KPI to set goals for how many leads you need to generate in order to meet sales goals.
Return on Ad Spend (ROAS)
Return on Ad Spend is basically ROI for your paid advertising efforts.
Instead of using total revenue and total cost, it uses revenue from ads compared to each dollar you spent on advertising. It doesn’t factor in the costs of managing the ads or producing the ad copy and creative.
It’s purely how much revenue you generated versus how much you spent on advertising.
Quality Score
The quality score tells you how well your ad and your landing page match the intent of someone searching for your target keyword.
On Google Ads, this is measured on a scale of 1-10, with 10 meaning your ad and landing page are highly relevant to the user and 1 meaning they’re not relevant at all. Google prioritizes ads with a higher quality score, so this is an important metric to track to ensure you’re optimizing your ads to be seen by as many people as possible. It will also help you improve your ad’s CTR and your page’s conversion rate.
Cost Per Click (CPC)
CPC measures how much money you pay for one click on your ad. If you’re using CPC bidding on Google Ads, you can set your max CPC (in other words, the most you’re willing to pay for a click). This doesn’t mean, however, that every click will cost this much, it just means that this is the highest you’ll ever pay for a click.
There are advanced bidding strategies that can automate the adjustment of your max CPC, but in general, you’ll use this metric to determine your bidding strategy and which keywords are the most cost effective for you to target.
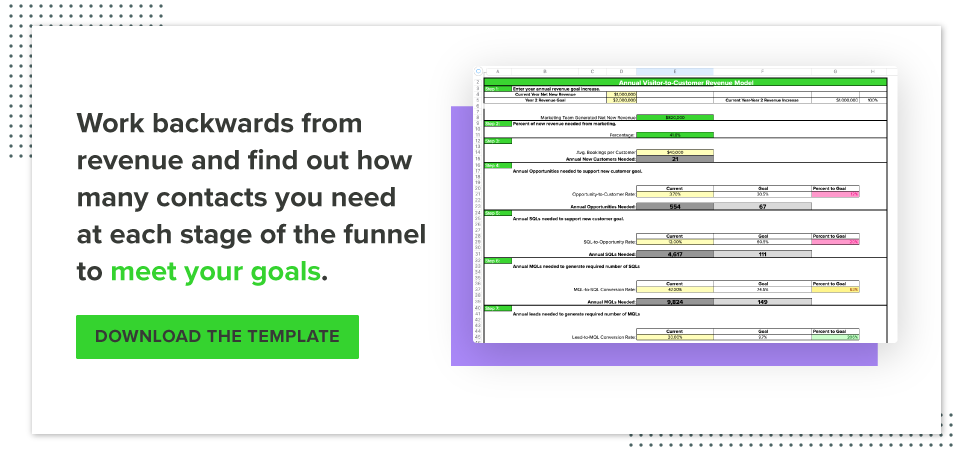
Choosing Your KPIs and Setting Goals
Not every KPI will be important for you to track. Obviously, you’ll want to calculate ROI. But other than that, the KPIs you choose to measure and set goals for will come down to your overall business goals and marketing strategy. A good way to start is by moving backward from your revenue goal to then determine the number of contacts you need at each stage of the funnel to hit your goal.
The most important thing is to simply start. You can always adjust which KPIs you’re tracking down the road and adjust your goals as necessary. To make things a little easier, you can use the Marketing Goals Calculator Template to set some initial goals to get started.
Tag(s):
Marketing